Alerts and Observability for Pipeline Monitoring and Cost Management

Have you ever wished that there was an automated way to receive a notification when a data issue occurs? Perhaps an email when credit consumption on a virtual warehouse exceeds a specific threshold, or a notification if you haven’t received new data in a stage in more than 30 minutes. It’s important to know when a task may have failed to run in your task graph so you can investigate the reason and execute a solution.
We all know how important it is to monitor your data and workloads, which is why we’re thrilled to announce two new features in private preview to help you observe both. The first is a new object called Snowflake Alerts. The second is no-code pipeline observability from within Snowsight, including task graph viewer and task history. Let’s explore both.
Snowflake Alerts: Observability Into Your Data and Workloads
To provide a repeatable and scalable way to proactively manage pipeline health, cost governance, and security risks, our native observability story continues to expand with the latest addition of Snowflake Alerts (currently in private preview). This has been a highly requested feature, and now our private preview customers can create alerts directly in Snowflake to gain observability into their data and workloads. When an alert is triggered, users can easily choose to take actions ranging from running SQL executables (e.g., to kick off downstream processing) to sending out a notification.
A quick feature overview
Snowflake Alerts have a schedule, condition, and action. Alerts are often used to send notifications about exceptional events; however, you can also use them to execute nearly any SQL statement.
- Create alerts as database objects
To create an alert, use the simple SQL syntax shown below in Figure 1.
CREATE [ OR REPLACE ] ALERT [ IF NOT EXISTS ]
  WAREHOUSE =
  SCHEDULE = '{  MINUTE | USING CRON   }'
  IF( EXISTS(

  ))
  THEN
[Caption] Figure 1: Alert syntax. Please note: The alert syntax is subject to change as this feature is currently in private preview.
The Snowflake Alerts syntax includes:
- The virtual warehouse the alert will execute on
- The condition to evaluate (e.g., the presence of queries that take longer than a second to complete)
- The schedule for evaluating the alert (e.g., every 24 hours, every Sunday at midnight)
- The action to perform when the condition evaluates to true (e.g., send an email notification, capture some data in a table, etc.)
Using this alert syntax, you can create alerts to monitor any data that you have access to inside Snowflake. You can also build a set of alerts that together support your business needs.
Figure 2 shows an alert example that monitors virtual warehouse credits spent in the last 24 hours and sends an email notification when the usage exceeds 10 credits.
CREATE ALERT Warehouse_Credit_Usage_Alert
	WAREHOUSE = my_warehouse
	SCHEDULE = ‘USING CRON 0 7 * * *UTC’ // everyday at 7 am
	IF (EXISTS (SELECT
		Warehouse_name,
		SUM(CREDITS_USED) AS credits
		FROM snowflake.account_usage.warehouse_metering_history
		// aggregate warehouse Credit_used for the past 24 hours
	WHERE datediff(hour, start_time, CURRENT_TIMESTAMP ())<=24
	GROUP BY 1
	HAVING credits > 10
	ORDER BY 2 DESC))
	THEN system$send_email (
		‘My_email_notification_integration’,
        ‘admin1@company,com, admin2@company.com’,
        ‘Email Alert: Excessive warehouse usage!’,
        ‘Warehouse usage exceeds 10 credits in the past 24 hours’
)
Figure 2: Alert example for monitoring virtual warehouse credits and sending notifications at a specific threshold.
This alert example uses the email notification stored procedure (system$send_email) provided by Snowflake to send emails when the alert is triggered. The email notification stored procedure is in public preview and available for all cloud platforms (AWS, Azure, and GCP).
1. Analyze and manage your alerts
Similar to other database objects in Snowflake, you can manage alerts by using the “SHOW ALERTS” command, which allows you to view all alerts with their status, creation times, and so on, or you can search for a specific alert to modify.
2. Monitor your alerts (alert on alerts!)
When an alert executes, a row is inserted into the alert history table to record the status of the execution. Instead of manually querying the alert history table to see whether alerts are being triggered as expected, you can automate this progress by creating an alert to monitor the alert history table. This “alert on alerts” capability provides you with a self-service troubleshooting mechanism to quickly detect and respond when alert execution encounters an issue; for example, if the alert evaluation query continues to fail due to source data being unavailable.
See Your Task Graph and History in Snowsight
Understanding the relationship and execution order of your Snowflake tasks just got easier with task graphs in Snowsight. Let’s take a look.
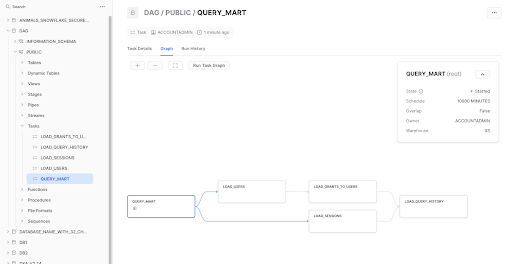
Task graph viewer
Here’s the scenario: You’ve built a complex task logic and want to see it. Rather than manually generating visualizations or having to parse through rows of task details and relationships, you can use task graphs. All you need to do is navigate to any task in the graph and select the “Graph” tab. And to execute a given set of tasks, you can execute the task graph by selecting “Run Task Graph.”
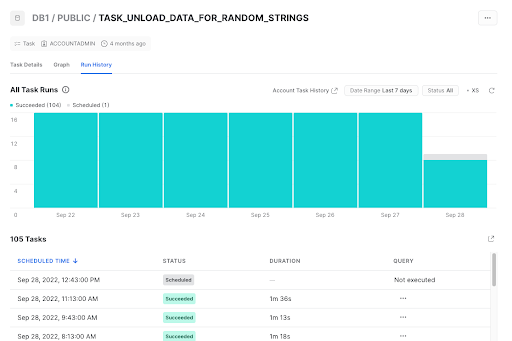
Task history
How do you know if a task has been running successfully, is failing, or is even scheduled to run in the future? Click on the “Run History” tab. Want to drill down into the data without having to write code? Just click on a bar, click on the legend, or use the filters in the upper right. What if you want to see a query of a failed run? You can effortlessly jump directly from a task run to the query profile.
Proactively managing pipeline health, cost governance, and security risks is getting much easier with all the upcoming functionality coming into preview. Both Snowflake Alerts and the email notification stored procedures are currently in private preview, and we are actively recruiting and onboarding private preview customers. It’s a great opportunity to experience these features and to see how they can support your needs. As a private preview participant, you can also help shape the future forms of these features by sharing your experiences and providing feedback. If you’re interested, please work with your Snowflake account team to get access to these private previews!

Looking for more data engineering insights to fuel your 2023? Join us January 18 for one of our most popular events each year, “6 Top Trends in Data Engineering for 2023.” Register today for this presentation/Q&A session to hear Snowflake product experts discuss the most impactful engineering trends you and your team should keep in mind in the new year.
Authors
