Profiling Python Stored Procedures to Identify Inefficiencies

Snowpark Python stored procedures provide users with the ability to execute custom Python code within the Snowflake environment, enabling more complex and flexible data processing workflows that leverage Python's rich ecosystem of libraries and functions. However, as the user code is executed inside the secure Snowflake environment, it can be challenging to investigate performance bottlenecks and identify inefficiencies.
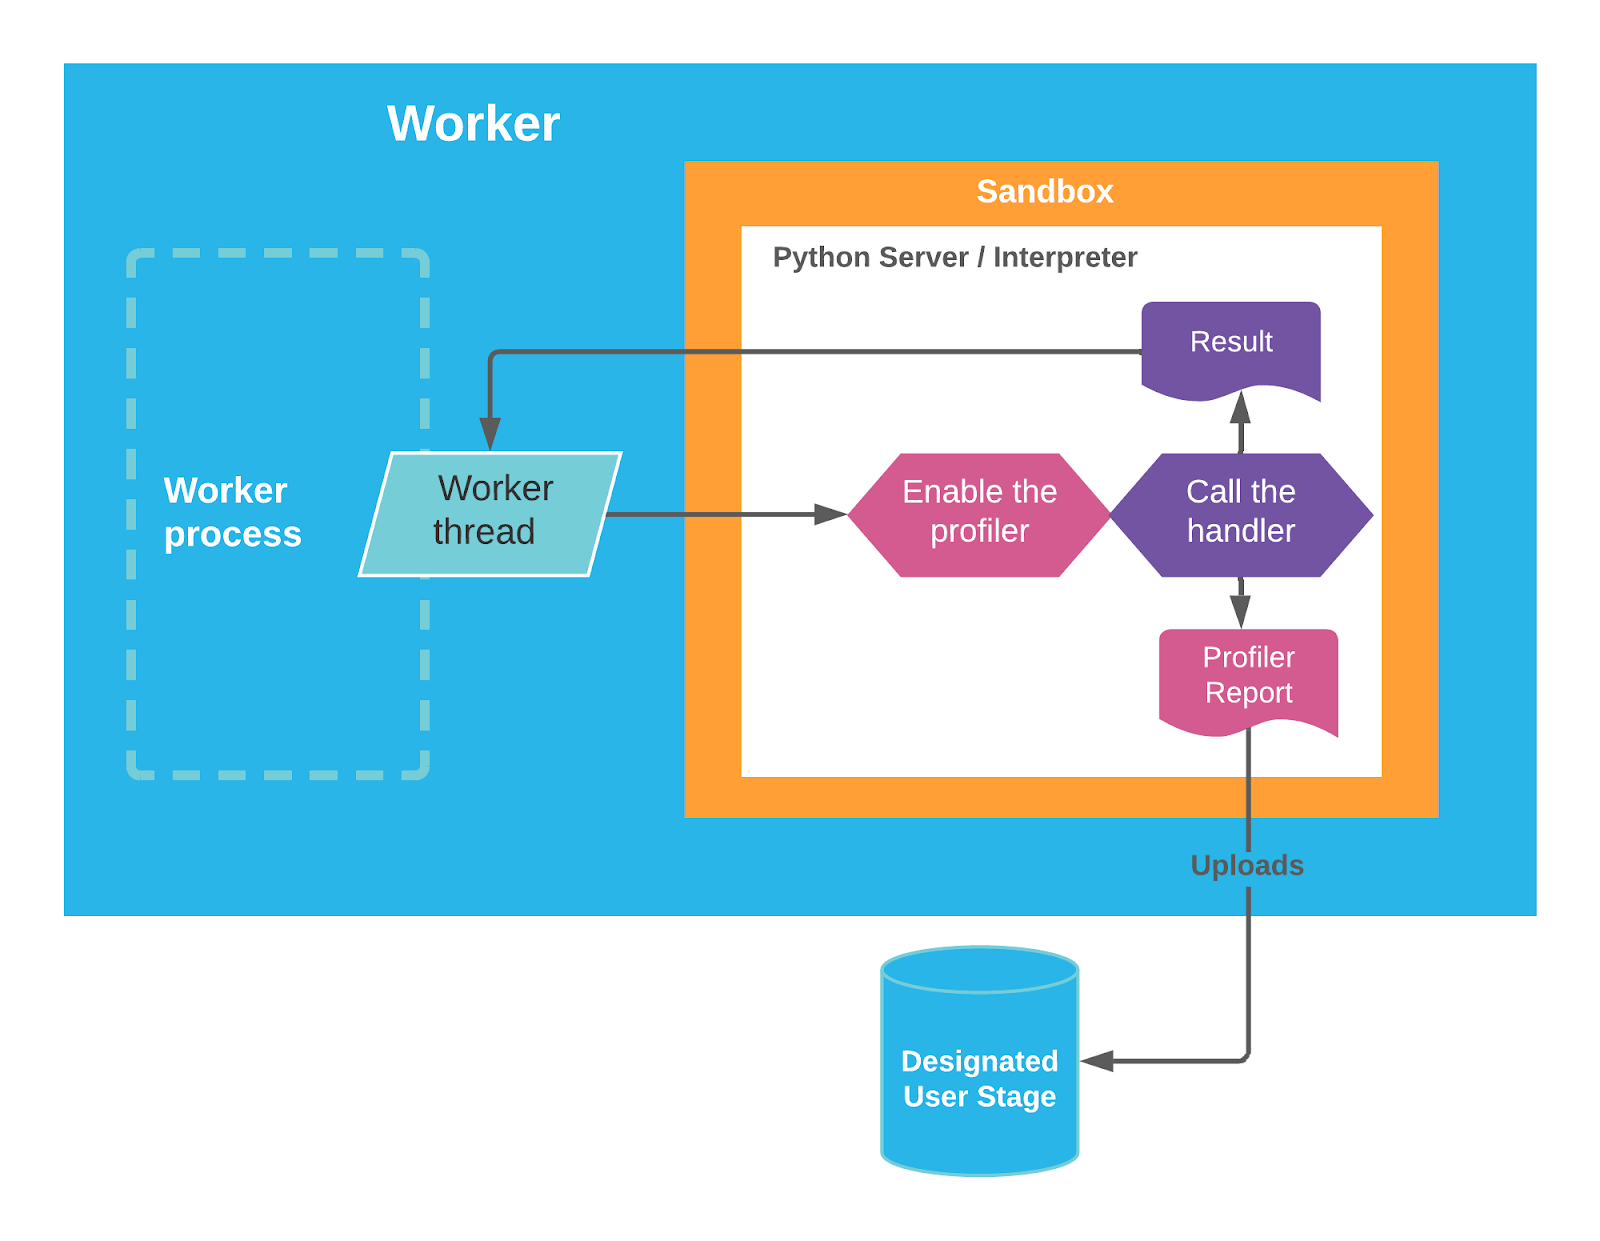
To address these challenges, Snowpark is introducing a new built-in Python profiler, which provides detailed insights into the execution time and memory usage of each line within the stored procedure’s user code. The profiler will upload the report to a stage designated by the user.
How to use the profiler?
Step 1: Set the destination stage for the profiler report.
profiler = session.stored_procedure_profiler()
profiler.set_target_stage("mydb.myschema.profiler_output")
Step 2: Enable the profiler, choosing whether you want to profile the execution time or memory usage.
profiler.set_active_profiler("LINE") # for execution time
profiler.set_active_profiler("MEMORY") # for memory usage
Step 3: Call your procedure as usual.
session.call("your_stored_procedure")Step 4: Get the profiler output.
profiler.get_output()What’s happening under the hood?
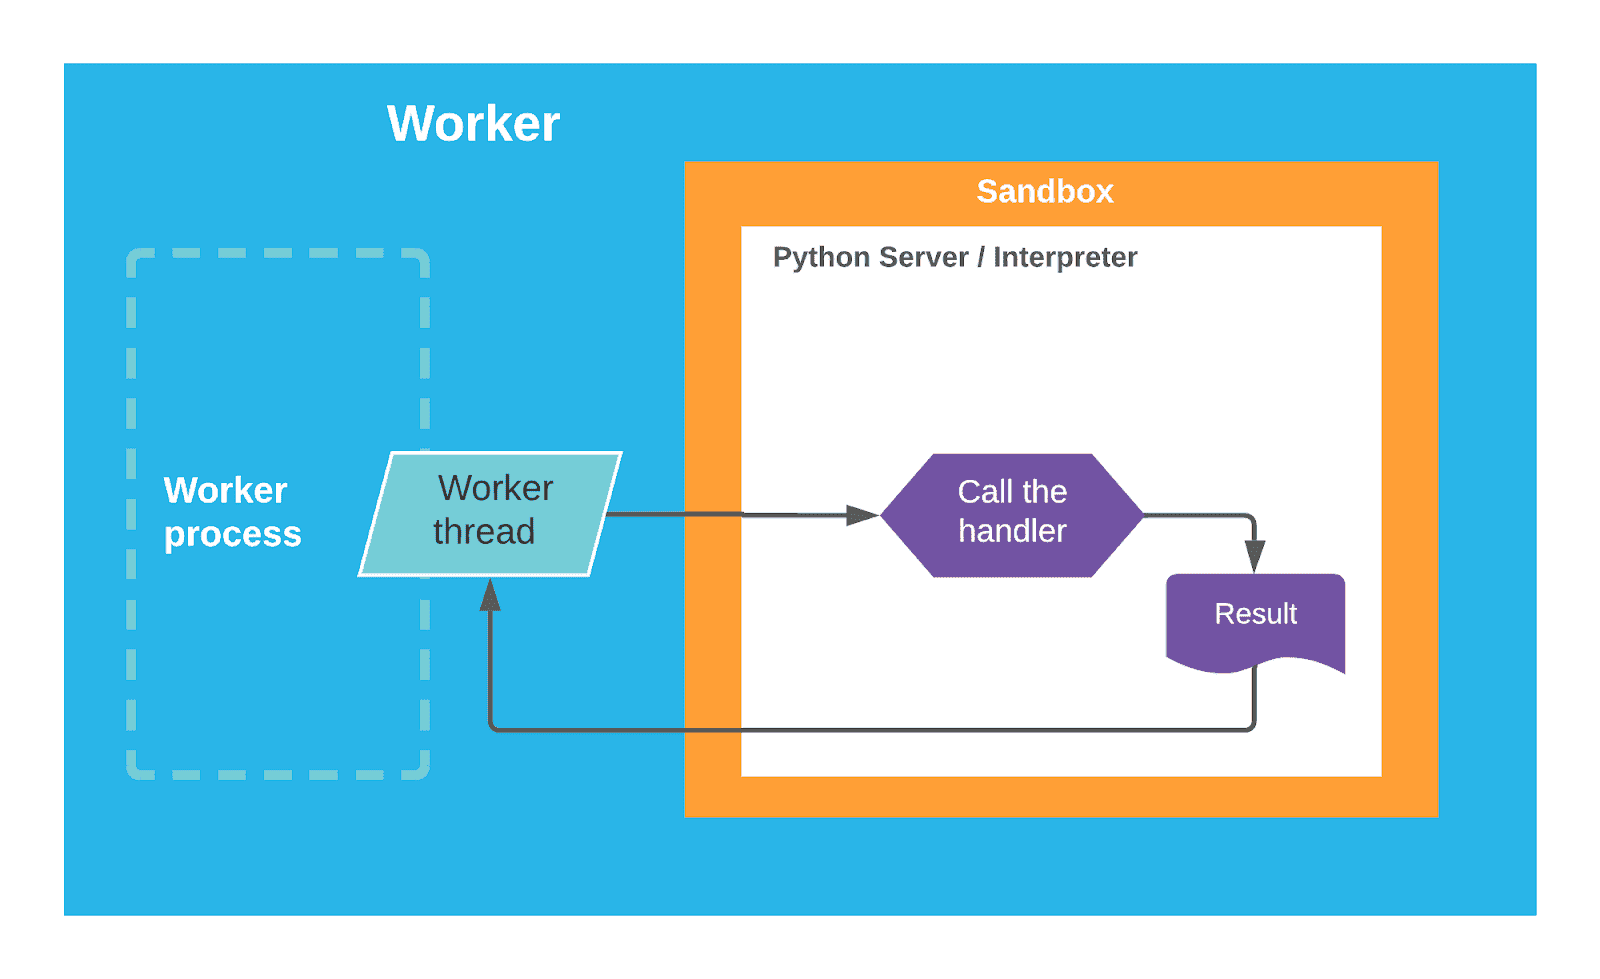
Figure 1 (below) shows an overview of the stored procedure’s execution. Inside the sandbox, we have a Python Interpreter process, which executes the user code.
As seen in Figure 2 (below), the profiler fits in the stored procedure’s execution. Inside the Python Interpreter process, the profiler is enabled before the handler is called, and after the handler execution is complete, the profiler uploads the report to the designated stage.
Understanding the profiler report
In this section, we’ll discuss how to identify performance bottlenecks using the profiler report.
Profiling execution time
In this example, we have a stored procedure that reads a text file with single-line JSON objects, one-json-per-line.txt, and extracts the fields under the "Property1" fields into a list.
import json, sys

def main():
   import_dir = sys._xoptions['snowflake_import_directory']
   json_file_path = import_dir + 'one-json-per-line.txt'
   objects = []
   with open(json_file_path, 'r') as json_file:
        for line in json_file:
            obj_dict = json.loads(line)
            objects.append(obj_dict["Object"]["Property1"])
   return objects
Profiling the sproc generated the following report:
Handler Name: main
Python Runtime Version: 3.9
Modules Profiled: ['main_module']
Timer Unit: 0.001 s

Total Time: 0.0114053 s
File: _udf_code.py
Function: main at line 4

Line #      Hits         Time  Per Hit   % Time  Line Contents
==============================================================
     4                                           def main():
     5         1          0.0      0.0      0.0     import_dir = sys._xoptions['snowflake_import_directory']
     6         1          0.0      0.0      0.0     json_file_path = import_dir + 'one-json-per-line.txt'
     7         1          0.0      0.0      0.0     objects = []
     8         1          0.2      0.2      1.7     with open(json_file_path, 'r') as json_file:
     9      1001          1.2      0.0     10.5          for line in json_file:
    10      1000          9.6      0.0     84.3              obj_dict = json.loads(line)
    11      1000          0.4      0.0      3.5              objects.append(obj_dict["Object"]["Property1"])
    12         1          0.0      0.0      0.0     return objects
In the header section, we can see the procedure's handler, the runtime version, the modules profiled and the timer unit (milliseconds). By default, we only profile the inline handler code, but the profiler can be extended to import third-party or other imported modules as well. (See “Including additional modules for profiling.”)
Following the header section, for each function, we see the total time (in seconds); the file, which contains the function definition; and the line number, where the function is defined.
Looking at the profiler report, we can see that 84.3% of the time was spent on loading the 1000 json object, totalling 9.6 milliseconds. We can improve the performance by using the UltraJson package instead of the native JSON module. Making this update and rerunning the procedure results in this updated report:
Handler Name: main
Python Runtime Version: 3.9
Modules Profiled: ['main_module']
Timer Unit: 0.001 s

Total Time: 0.00499573 s
File: _udf_code.py
Function: main at line 4

Line #      Hits         Time  Per Hit   % Time  Line Contents
==============================================================
     4                                           def main():
     5         1          0.0      0.0      0.0     import_dir = sys._xoptions['snowflake_import_directory']
     6         1          0.0      0.0      0.0     json_file_path = import_dir + 'one-json-per-line.txt'
     7         1          0.0      0.0      0.0     objects = []
     8         1          0.1      0.1      1.2     with open(json_file_path, 'r') as json_file:
     9      1001          0.4      0.0      8.0          for line in json_file:
    10      1000          4.1      0.0     82.0              obj_dict = ujson.loads(line)
    11      1000          0.4      0.0      8.8              objects.append(obj_dict["Object"]["Property1"])
    12         1          0.0      0.0      0.0     return objects
Looking at the updated report, we see that it now takes only 4.1 milliseconds to load the JSON objects — almost 2x faster. By using the profiler to identify the performance bottleneck, we were able to make this simple change, which cut the execution time in half.
Profiling memory usage
In this example, we want to use a stored procedure to get the average student age, grouped by sex, from a table with 1 million rows. We want the result to be a pandas DataFrame. In this first attempt, we load the table into a pandas DataFrame and use pandas' groupby() and mean() operations.
from snowflake.snowpark.functions import col

def main(session, table):
  pandas_df = session.table("STUDENTS").to_pandas()
  return pandas_df[["AGE", "SEX"]].groupby("SEX").mean()
Profiling the sproc, we get the following report:
Handler Name: main
Python Runtime Version: 3.8
Modules Profiled: ['main_module']
File: _udf_code.py
Function: main at line 4

Line #    Mem usage    Increment  Occurrences   Line Contents
=============================================================
     4    284.3 MiB    284.3 MiB           1   def main(session, table):
     5    387.5 MiB    103.2 MiB           1     pandas_df = session.table("STUDENTS").to_pandas()
     6    391.5 MiB      4.0 MiB           1     return pandas_df[["AGE", "SEX"]].groupby("SEX").mean()
Similar to the execution time report, we have a header with the handler name, Python runtime version and modules profiled. We also have the file path and line number for each function.
Looking at the report, the first line tells us that the overhead memory of running this stored procedure is 284.3 MB — that is, the memory required regardless of the handler's content. The second line adds an increment of 103.2 MB — the size of the table loaded into a pandas DataFrame. Finally, computing the average age, grouped by the sex, uses 4 MB. We can clearly see that the most expensive operation is loading the table into a pandas DataFrame. Can we do better?
Yes, we can rely on native Snowpark DataFrame operations to achieve the same result, and then convert the Snowpark DataFrame to a pandas DataFrame.
from snowflake.snowpark.functions import col

def main(session, table):
    df = session.table(table).group_by("sex").function("avg")("age")
    return df.to_pandas()
Profiling the updated stored procedure, we get:
Handler Name: main
Python Runtime Version: 3.8
Modules Profiled: ['main_module']
File: _udf_code.py
Function: main at line 4

Line #    Mem usage    Increment  Occurrences   Line Contents
=============================================================
     4    268.8 MiB    268.8 MiB           1   def main(session, table):
     5    272.8 MiB      4.0 MiB           1       df = session.table(table).group_by("sex").function("avg")("age")
     6    273.8 MiB      1.0 MiB           1       return df.to_pandas()
From the updated report, we see that we were able to save ~100 MB by applying the groupby operation first and relying on native Snowpark DataFrame operations instead of loading the full table into a pandas DataFrame.
Freed memory
The profiler is also able to report on any freed memory once an object has been released. In this example, the handler is allocating 5 GB of memory, then deleting them before returning.
def main():
    storage = []
    gb_in_bytes = 1024 * 1024 * 1024
    gb_in_use = 5

    for _ in range(gb_in_use):
        storage.append(bytearray(gb_in_bytes))

    del storage
    return "success"
Profiling the sproc, we get the following report:
Handler Name: main
Python Runtime Version: 3.8
Modules Profiled: ['main_module']
File: _udf_code.py
Function: main at line 2

Line #    Mem usage    Increment  Occurrences   Line Contents
=============================================================
     2    283.3 MiB    283.3 MiB           1   def main():
     3    283.3 MiB      0.0 MiB           1       storage = []
     4    283.3 MiB      0.0 MiB           1       gb_in_bytes = 1024 * 1024 * 1024
     5    283.3 MiB      0.0 MiB           1       gb_in_use = 5
     6
     7   5433.3 MiB      0.0 MiB           6       for _ in range(gb_in_use):
     8   5433.3 MiB   5150.0 MiB           5           storage.append(bytearray(gb_in_bytes))
     9
    10    303.3 MiB  -5130.0 MiB           1       del storage
    11    303.3 MiB      0.0 MiB           1       return "success"
Using the profiler to investigate OOM errors
The examples we've discussed assume that the stored procedure executed successfully, but what happens if the procedure OOMs? What will the profiler output look like?
Following the same example from above, let's run the original handler on a table with 1 billion rows instead. Unsurprisingly, the stored procedure runs out of memory as it's trying to load 1 billion rows into a pandas DataFrame. What's interesting is what the report looks like:
Handler Name: main
Python Runtime Version: 3.8
Modules Profiled: ['main_module']
File: _udf_code.py
Function: main at line 4

Line #    Mem usage    Increment  Occurrences   Line Contents
=============================================================
     4    289.0 MiB    289.0 MiB           1   def main(session, table):
     5                                           pandas_df = session.table("STUDENTS").to_pandas()
     6                                           return pandas_df[["AGE", "SEX"]].groupby("SEX").mean()
The profiler output is truncated at the line that causes the OOM error. We can clearly see that line 5 never successfully finishes execution, so we are able to determine that this is where the OOM error occurred. This leads us to the conclusion that we should avoid trying to load a table with 1 billion rows into a pandas DataFrame.
Conclusion
In this blog post, we discussed how the new built-in Python profiler is integrated in the Python stored procedure execution, how to understand the profiler's report, and how it can be used to investigate performance bottlenecks and identify inefficiencies related to memory usage and execution time.
To get started with the profiler, check out the Python and SQL developer guides.
Authors